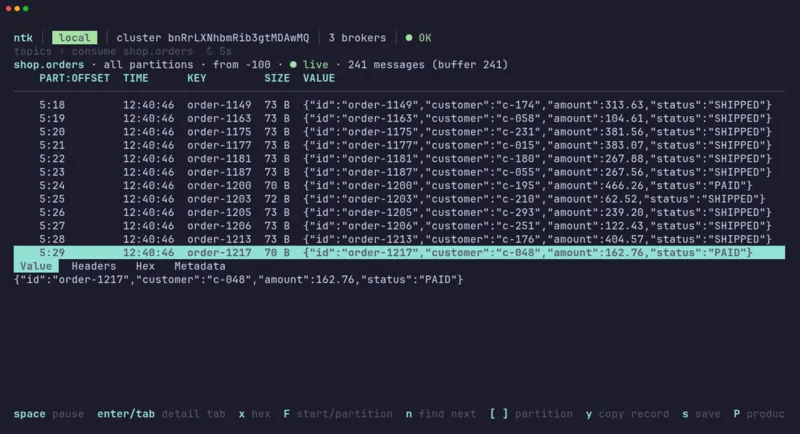
Something is off with orders. You want to see the last few messages on the topic, find out which consumer group is behind, and maybe nudge an offset. That should take a minute. Too often it takes ten: the right bootstrap address, the right properties file, a different script for every job, and a terminal full of output that was never meant to be read by a person.
Today we're releasing ntk, the tool we reach for when we need to look at a Kafka cluster right now. It's a command-line tool and a terminal UI in one static binary, licensed under Apache 2.0, with no JVM to start and no telemetry. It works with any Apache Kafka cluster, 3.x or 4.x, and it's what we use every day against ntail.
ntk topic list                       # what's here?
ntk consume orders --from -10        # the last 10 messages per partition
ntk produce orders -k k1 -v hello    # send one
ntk group watch billing              # live lag, rates, time to catch up
ntk                                  # or open the TUI
That's most of a working day. Here's what makes it feel good.
Install it, point it at a cluster, look around
Download one binary for Linux, macOS, Windows or FreeBSD, put it on your PATH, and you're done. There's a Docker image if you'd rather not install anything. Then tell ntk about a cluster:
ntk profile create     # a short wizard: servers, security, test, save
ntk topic list
ntk                    # the TUI
The wizard asks for a name, the bootstrap servers and how to authenticate, tests the connection, and saves. From then on ntk knows where the cluster is. Shell completion knows what's on it, too: ntk topic describe <tab> completes against the live topic list, and the same goes for groups, brokers, principals and config keys.
Profiles: set a cluster up once, never type it again
Bootstrap servers, TLS settings, SASL credentials, a CA file: the details of reaching a cluster belong in one place, not on the command line of every call you make. In ntk that place is a profile. You enter the connection once, give it a name, and from then on commands are just the verb and the topic. One profile is active at a time, and switching is a single command. Plaintext, TLS, mTLS, SASL PLAIN and SCRAM are all supported, in any combination, and if you already have a Java client.properties you can import it instead of retyping it.
ntk profile set staging       # from here on, everything is staging
ntk topic list
ntk consume orders --from -10
ntk profile switch            # or pick from a list
For the occasional one-off against another cluster, -p overrides the active profile for a single command, and NTK_PROFILE does the same for a whole shell session:
ntk -p prod group list --lag
export NTK_PROFILE=prod
When a connection doesn't work, you want to know which part doesn't work. ntk profile test walks the connection one step at a time and tells you where it broke:
$ ntk profile test prod
✓ DNS         kafka.example.com → 10.0.0.12
✓ TCP         kafka.example.com:9093
✓ TLS         server cert kafka.example.com, issuer Example CA, expires in 212d
✓ SASL        scram-sha-512 as svc-ops
✓ Metadata    cluster abc123 · 6 brokers · controller 2 · Kafka 3.9
✓ Principal   User:svc-ops (derived)
Profiles are also where production stays safe. Mark the profile you use to look at prod as read_only and every write is refused. Keep a second one for the rare change, and set its deletion_prevention to always so a stray delete is refused outright, or leave it at prompt so you see the plan and get asked first. Every profile also carries a colour, and that colour is on the badge in every TUI view and on every confirmation prompt, so you always know which cluster you're about to change.
ntk profile copy prod prod-admin
ntk profile edit prod --set read_only=true
ntk profile edit prod-admin --set deletion_prevention=always
The TUI is the CLI
Run ntk with no arguments and it opens on the topic list of your active profile. Press enter on a topic for its partitions, config, consumers and ACLs. Press c for a live message browser, m to watch its throughput, e to edit its config. Type : to jump anywhere (:groups, :health, :consume orders, :ctx prod), / to filter the table, ? for the keys of whatever view you're in.
The message browser is the view we use most. New messages stream in at the bottom, space pauses them, tab flips the detail pane between the value, the headers, a hex dump and the metadata, / finds text, and s saves what's loaded to a file. Spot a message you need to send again? P opens it in the composer, and you resend it with whatever changes you make.
Every view in the TUI runs the same code as the command line, and it will tell you so: press Y and the exact CLI command for what you're looking at is on your clipboard. That makes the TUI a pleasant way to learn the CLI. Find the view by clicking around, copy the command, put it in a script.
Changing things works the same way in both. Every write shows the plan the CLI would print and asks for confirmation. A read-only profile hides the write actions altogether, and deletion_prevention applies to deletes in the TUI exactly as it does on the command line. You can also open the TUI straight at a view, which is handy for the one you check ten times a day:
ntk tui groups
ntk tui consume orders
Bytes in, bytes out
ntk never decodes, re-encodes or pretty-prints a message. What it gives you is what's in the log, one value per line on stdout, with everything else (progress, warnings, prompts) on stderr. That one rule is what makes it a good citizen in a pipeline, because your shell already has the tools for the rest. JSON on the topic? Pipe it to jq:
ntk consume orders --from -1h | jq -c 'select(.status == "FAILED") | {id, amount}'Need the key, partition, offset and headers as well? Add -m and each message is preceded by a one-line JSON header:
$ ntk consume orders --from -1 -m
{"topic":"orders","partition":0,"offset":59,"timestamp":"2026-10-09T12:26:20.541Z","timestamp_type":"create","key":"order-1234","headers":[{"key":"source","value":"checkout"},{"key":"tenant","value":"acme"}],"value_size":70,"value_null":false}
{"id":"order-1234","customer":"c-273","amount":228.11,"status":"PAID"}
Or hand each message to a command of your own. -o exec: runs it once per message with the bytes on stdin and the key, partition and offset in NTK_* environment variables. Message content never touches your command line, so it can't break your shell:
ntk consume orders --from -1h -o 'exec:jq -c "select(.status == \"FAILED\")"'
ntk consume orders -o 'exec:./handle.sh' --receipt | wc -l
Producing is the same idea in reverse. Whatever arrives on stdin becomes messages, one per line, so anything that writes lines can write to Kafka. Given the name of this company, we're obliged to show this one:
tail -f /var/log/app.log | ntk produce app.logs
kubectl logs -f deploy/api | ntk produce api.logs
ntk produce orders --key-sep ':' < pairs.txt        # key:value per line
Because consume writes exactly what produce reads, the two chain. Export a day of traffic and replay it on staging, or skip the file and pipe one cluster into another. With -m on both sides, keys, headers and tombstones ride along:
ntk consume orders --from -1d -o jsonl > yesterday.jsonl
ntk -p staging produce orders --in jsonl -f yesterday.jsonl

ntk -p prod consume orders --from -1h -m | ntk -p staging produce orders -m
Every listing command speaks JSON as well, with stable field names, and -o name prints one name per line for xargs:
ntk topic list -o json | jq -r '.[] | select(.partitions > 6) | .name'
ntk topic list 'tmp.*' -o name | xargs ntk topic delete --dry-run
Exit codes mean something, so scripts can branch on them: 3 when it can't connect, 4 when a resource is missing, 5 when a check fails, 7 when you're not authorised. A lag check with a threshold is a one-line alert condition, and a health check is a one-line readiness probe:
ntk group lag billing --threshold 10000 --max-time-lag 5m || notify-oncall
ntk health --fail-on warn
Need a quick load test? --template turns the value into a template, --count and --rate do the rest:
ntk produce orders -k 'order-{{.i}}' -v '{"id":{{.i}},"t":"{{now}}"}' --template --count 10000 --rate 500/sWhen the bytes aren't text
Everything above assumed the values are text, one per line. Protobuf, Avro and other binary encodings can't promise that: a serialised message may contain any byte, the newline included. So for binary payloads ntk has two outputs that hand each message over whole, with nothing split and nothing escaped. -o exec: gives a command the bytes on stdin, one message per run. -o unix: sends each message as one datagram to a Unix socket.
Say orders carries Protobuf and you have the schema:
// order.proto
syntax = "proto3";
package shop;

message Order {
  string id       = 1;
  string customer = 2;
  double amount   = 3;
  string status   = 4;
}
Decode each message to JSON with the schema, and from there jq takes over as if the topic had been JSON all along. Here with buf:
$ ntk consume orders --from -1h \
    -o 'exec:buf convert order.proto --type=shop.Order --from=-#format=binpb --to=-#format=json' \
    | jq -c 'select(.status == "FAILED") | {id, amount}'
{"id":"order-3004","amount":730.1}
{"id":"order-3002","amount":19.99}
No plugin, no decoder configuration inside ntk, and when the schema changes you change the command, not the tool. The same shape works for Avro with the decoder of your choice, or for anything you can describe as "a program that reads one message on stdin".
The socket is for the long-running case: a program that isn't a Kafka client and shouldn't have to become one. It binds a datagram socket and reads one message per receive, with the bytes exactly as they were produced:
# receiver.py
import socket
import order_pb2

sock = socket.socket(socket.AF_UNIX, socket.SOCK_DGRAM)
sock.bind("/run/myapp/orders.sock")
while True:
    order = order_pb2.Order.FromString(sock.recv(1 << 20))
    handle(order)
ntk consume orders -f -o unix:/run/myapp/orders.sock --unix-waitIt works in the other direction too. ntk produce orders --in unix:/run/myapp/orders.sock listens on the socket, and anything that can send a datagram can now write to Kafka: sock.sendto(order.SerializeToString(), "/run/myapp/orders.sock") is the whole producer. On Windows a named pipe does the same job, with npipe: in place of unix:.
Watch without agents
ntk computes rates from offsets, so it monitors any cluster with nothing installed on the brokers. topic watch gives you per-partition message rates, size and skew, redrawn in place. group watch shows lag with a trend sparkline, consume and produce rates, how old the oldest unconsumed message is, an ETA to catch up and a plain status: ok, catching up, falling behind, stuck or rebalancing. Piped, both print one sample per interval, which is the easiest way we know to log throughput over time.
And when you just want to know whether the cluster is OK, ntk health runs a dozen checks in one go:
$ ntk health
Cluster bnRrLXNhbmRib3gtMDAwMQ · Kafka 4.3 · 3 brokers · KRaft (3 voters)
✓ brokers            3/3 reachable
✓ controller         1
✓ quorum             leader 1, max voter lag 0
✓ offline            0
✓ under-replicated   0
✓ under-min-isr      0
✓ at-min-isr         0
✓ leader-imbalance   0.0% of partitions not on their preferred leader
✓ reassignments      none
✓ log-dirs           3 dirs, no errors
✓ disk               max 31% (broker 1)
✓ transactions       no hanging transactions
Status: OK
A plan before every change
Creating, deleting, resetting, granting: ntk shows you the exact effect before anything happens. --dry-run works on every command that changes something, and offset resets are a dry run by default, so you can see what a reset would do and then add --execute when you mean it:
$ ntk group reset billing --topic orders --to-earliest
Reset offsets for group "billing":
  TOPIC     PART   CURRENT       NEW      DIFF
  orders       0        31         0       -31
  orders       1        35         0       -35
  ! 66 messages will be re-consumed
(dry run; add --execute to apply)
A plan can also be saved and applied later, after someone else has looked at it. It records which cluster it was made against, and ntk apply refuses to run it anywhere else:
ntk topic delete orders.tmp --dry-run -o json > plan.json
ntk apply plan.json
ACLs get the same treatment, with a twist: you grant by role instead of by operation, because nobody remembers that a consumer needs READ and DESCRIBE on the topic and READ on the group. ntk acl grant consumer does, and shows you the exact ACLs before creating them. When something is denied and you can't see why, ntk acl check evaluates the rules the way the broker does and names the one that decided.
ntk acl grant consumer --principal User:svc-reporting --topic orders --group svc-reporting
ntk acl check --principal User:svc-reporting --operation write --topic orders
Built by ntail, works with any Kafka
We built ntk because we needed it. Running a serverless Kafka service means looking at a lot of clusters, quickly, from a terminal, and we wanted one tool that did that well. Standard Kafka clients and tooling work unchanged against ntail, so ntk does too, but nothing in it is specific to us: point it at whatever Kafka you have.
If you'd like somewhere to point it, ntail has a free plan with no card required: 200 KiB/s data in, 400 KiB/s data out, 1-day retention and up to 10 topics, with no time limit. Create a cluster in the console, run ntk profile create with the bootstrap server and credentials it gives you, and ntk topic list is your first command.
ntk is on GitHub under the Apache 2.0 licence, with a guide of short chapters and --help on every command. Every command is tested against a real three-broker cluster on every change, and the repository ships that sandbox too, with plaintext, mTLS and SCRAM listeners, if you want a safe place to try the destructive bits. Bug reports and ideas are very welcome as issues. Tell us what's missing.